
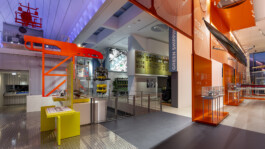
For the new permanent exhibition Ship Realms – The Ocean and Us at the German Maritime Museum (Deutsches Schifffahrtsmuseum) in Bremerhaven, SCHNELLE BUNTE BILDER developed a series of interactive media exhibits spread across the main exhibition areas: Environment, Physics, Equipment, Research and Shipbuilding.
I. Environment & Physics
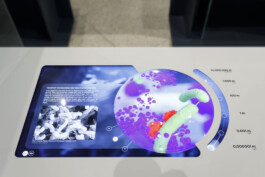
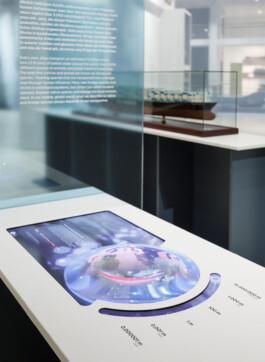
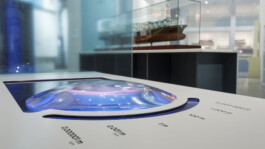
Sea Change
“Up to 350,000 microorganisms can be contained in a single drop of seawater.” Inspired by this view into a drop of water, the Sea Change exhibit lets visitors explore how the oceans are changed by the transport of ballast water and the entry of plastics.
While looking through a glass lens, visitors use a touch slider to move between different zoom levels. Starting from the blue planet, on which the global trade routes of container ships become visible, the camera moves through the simulated marine worlds and finally ends up with nanoplastics, bacteria, and viruses—the smallest particles at the nanoscale.
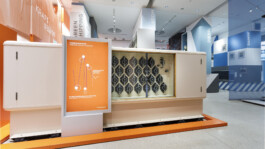
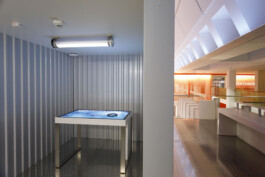
Tide-predicting Machine
Before digital computers could be used to predict high and low tides, scientists tried to calculate them using mechanical devices. The museum displays one of these so-called tide-predicting machines from the 1950s. An animation illustrates the general principles of tide calculation and transfers them onto the visible mechanics of the machine.
II. Equipment
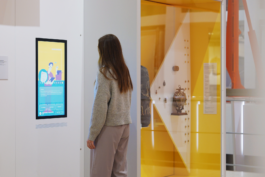
Professions
In addition to the equipment, the distribution of tasks among the crew is essential for smooth operations on deck. What professions are there on board a ship? A quiz station specially designed for children introduces the people behind the various tasks, provides surprising insights, and challenges common clichés.
III. Research Ship
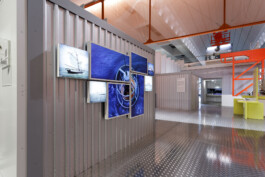
Working on Deck
The center of the exhibition is characterised by a large-scale stylised reconstruction of a research ship that can be discovered over two floors.
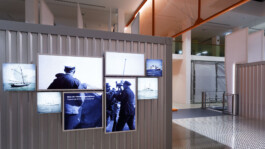
An animation welcomes visitors to the ship and tells the story of four important German research voyages between the years 1823–2004. The images and videos on display allow comparisons to be made between the missions. Which work processes, tools, and events are similar? What differences and technical developments become visible?
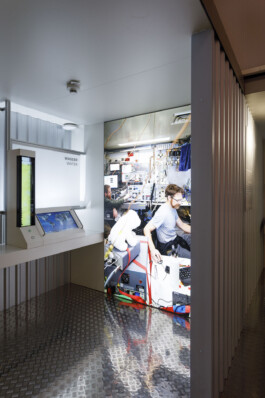
Laboratory
The laboratory of the research ship provides an insight into scientific work during an expedition. Exemplary research projects for the three work areas—Water, Seabed, and Air—are presented, and the underlying scientific processes, tools, and principles are explained. Interactive media exhibits are complemented by in-depth interviews with experts.
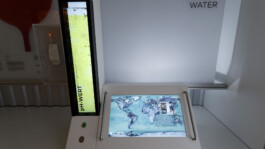
Water — pH Value
An important area of research is the pH value of seawater, which has changed over the past few decades. An interactive water tank allows visitors to learn about the pH of various liquids by pumping CO₂ into the tank at the touch of a button.
The pH changes are then put in perspective on the screen. Even much smaller changes in pH have had drastic consequences.
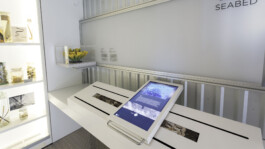
Seabed — Sediment Sample
The deposition of sediments on the seafloor over long periods of time creates a kind of record of an ecosystem that can be studied and analyzed by taking sediment cores. The core on display in the exhibition covers a period of several centuries and can be explored using a mobile screen. As visitors move along a timeline, they learn about the corals in the core and how they represent the fastest sea-level rise ever discovered.
Logistics Control
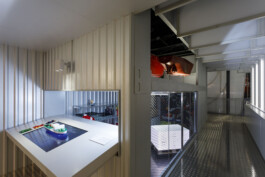
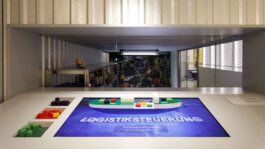
A successful expedition requires sophisticated logistics. The distribution of the cargo has to be calculated precisely. The exhibit is based on physically accurate calculations and translates them into a playful application. Visitors are asked to load the ship correctly for various research expeditions. Not only the total weight but also the distribution of the weight among the different compartments plays an important role.
Provision Pallet
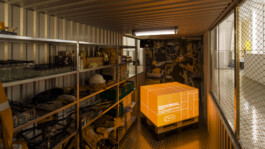
Large quantities of food, personal gear, research equipment, and consumables are needed for expeditions that can last months. The projection on the supply pallet gives a glimpse of the interesting, surprising, and sometimes amusing composition of the cargo.
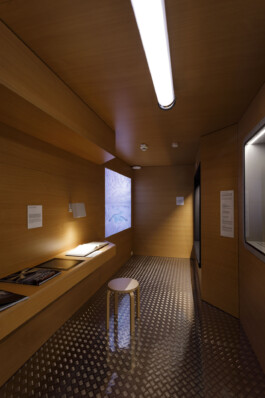
Chamber
In the chamber, visitors are given a personal insight into the experience of being on a research vessel. A projection shows private photographs of current expeditions, supplemented by recorded reports from expedition participants.
An interactive book invites visitors to travel back in time. Captain Spieß documented his impressions during the German Meteor expedition (1925–1927) in the form of a diary. Recorded excerpts can be listened to as visitors flip through the book.
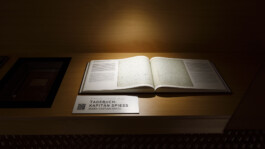
Diary: Captain Spiess
A camera detects the open page and plays its contents as a spoken audio track through the built-in speaker.
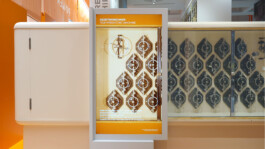
Chart Table
Nautical charts have changed in form and purpose over the last century. Initially, they were purely representations of voyage routes, but over time, more and more data was integrated into the charts. The example of four expedition charts illustrates this development. A digital magnifying glass allows visitors to playfully explore the routes of the expeditions and the data visualized on the maps.

IV. Shipbuilding
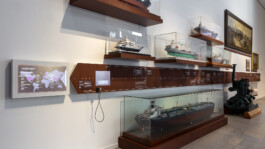
World Map Shipyards
Integrated into a large timeline of shipbuilding in the Bremerhaven area, the animated infographic shows how shipbuilding in Germany has developed over the past decades and places this development in a global context.
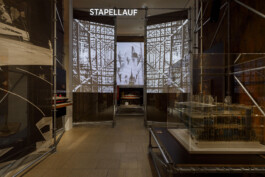
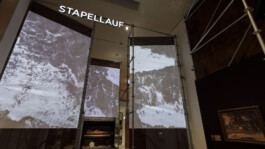
Launching
At the end of the shipbuilding process, ships are launched. The launching of a ship was a social event 100 years ago. Original footage of several of these historic events was recomposed to give an atmospheric insight into the occasion.
Client
Deutsches Schifffahrtsmuseum
Credits
Exhibition Design
chezweitz GmbH
Concept, Design and Production Media Exhibits
SCHNELLE BUNTE BILDER
Media Technology Planning
SCHNELLE BUNTE BILDER in collaboration with hergarten / interactive environments
Mediea Technology Execution
235 Media GmbH
Special Construction for Media Exhibits
Expotec GmbH
Sound Design Gezeitenrechner & Stapellauf
kling klang klong
Video Documentation
Frank Sauer
Photography
Nicole Werner
Alexander Butz für chezweitz GmbH
For the new permanent exhibition Ship Realms – The Ocean and Us at the German Maritime Museum (Deutsches Schifffahrtsmuseum) in Bremerhaven, SCHNELLE BUNTE BILDER developed a series of interactive media exhibits spread across the main exhibition areas: Environment, Physics, Equipment, Research and Shipbuilding.
I. Environment & Physics
Sea Change
“Up to 350,000 microorganisms can be contained in a single drop of seawater.” Inspired by this view into a drop of water, the Sea Change exhibit lets visitors explore how the oceans are changed by the transport of ballast water and the entry of plastics.
While looking through a glass lens, visitors use a touch slider to move between different zoom levels. Starting from the blue planet, on which the global trade routes of container ships become visible, the camera moves through the simulated marine worlds and finally ends up with nanoplastics, bacteria, and viruses—the smallest particles at the nanoscale.
Tide-predicting Machine
Before digital computers could be used to predict high and low tides, scientists tried to calculate them using mechanical devices. The museum displays one of these so-called tide-predicting machines from the 1950s. An animation illustrates the general principles of tide calculation and transfers them onto the visible mechanics of the machine.
II. Equipment
Professions
In addition to the equipment, the distribution of tasks among the crew is essential for smooth operations on deck. What professions are there on board a ship? A quiz station specially designed for children introduces the people behind the various tasks, provides surprising insights, and challenges common clichés.
III. Research Ship
Working on Deck
The center of the exhibition is characterised by a large-scale stylised reconstruction of a research ship that can be discovered over two floors.
An animation welcomes visitors to the ship and tells the story of four important German research voyages between the years 1823–2004. The images and videos on display allow comparisons to be made between the missions. Which work processes, tools, and events are similar? What differences and technical developments become visible?
Laboratory
The laboratory of the research ship provides an insight into scientific work during an expedition. Exemplary research projects for the three work areas—Water, Seabed, and Air—are presented, and the underlying scientific processes, tools, and principles are explained. Interactive media exhibits are complemented by in-depth interviews with experts.
Water — pH Value
An important area of research is the pH value of seawater, which has changed over the past few decades. An interactive water tank allows visitors to learn about the pH of various liquids by pumping CO₂ into the tank at the touch of a button.
The pH changes are then put in perspective on the screen. Even much smaller changes in pH have had drastic consequences.
Seabed — Sediment Sample
The deposition of sediments on the seafloor over long periods of time creates a kind of record of an ecosystem that can be studied and analyzed by taking sediment cores. The core on display in the exhibition covers a period of several centuries and can be explored using a mobile screen. As visitors move along a timeline, they learn about the corals in the core and how they represent the fastest sea-level rise ever discovered.
Logistics Control
A successful expedition requires sophisticated logistics. The distribution of the cargo has to be calculated precisely. The exhibit is based on physically accurate calculations and translates them into a playful application. Visitors are asked to load the ship correctly for various research expeditions. Not only the total weight but also the distribution of the weight among the different compartments plays an important role.
Provision Pallet
Large quantities of food, personal gear, research equipment, and consumables are needed for expeditions that can last months. The projection on the supply pallet gives a glimpse of the interesting, surprising, and sometimes amusing composition of the cargo.
Chamber
In the chamber, visitors are given a personal insight into the experience of being on a research vessel. A projection shows private photographs of current expeditions, supplemented by recorded reports from expedition participants.
An interactive book invites visitors to travel back in time. Captain Spieß documented his impressions during the German Meteor expedition (1925–1927) in the form of a diary. Recorded excerpts can be listened to as visitors flip through the book.
Diary: Captain Spiess
A camera detects the open page and plays its contents as a spoken audio track through the built-in speaker.
Chart Table
Nautical charts have changed in form and purpose over the last century. Initially, they were purely representations of voyage routes, but over time, more and more data was integrated into the charts. The example of four expedition charts illustrates this development. A digital magnifying glass allows visitors to playfully explore the routes of the expeditions and the data visualized on the maps.
IV. Shipbuilding
World Map Shipyards
Integrated into a large timeline of shipbuilding in the Bremerhaven area, the animated infographic shows how shipbuilding in Germany has developed over the past decades and places this development in a global context.
Launching
At the end of the shipbuilding process, ships are launched. The launching of a ship was a social event 100 years ago. Original footage of several of these historic events was recomposed to give an atmospheric insight into the occasion.
Client
Deutsches Schifffahrtsmuseum
Credits
Exhibition Design
chezweitz GmbH
Concept, Design and Production Media Exhibits
SCHNELLE BUNTE BILDER
Media Technology Planning
SCHNELLE BUNTE BILDER in collaboration with hergarten / interactive environments
Mediea Technology Execution
235 Media GmbH
Special Construction for Media Exhibits
Expotec GmbH
Sound Design Gezeitenrechner & Stapellauf
kling klang klong
Video Documentation
Frank Sauer
Photography
Nicole Werner
Alexander Butz für chezweitz GmbH
SCHNELLE BUNTE BILDER
Huber-Pohle-Timpernagel GbR
Rudolfstraße 11
D-10245 Berlin
mail@schnellebuntebilder.de
+49 30 983 884 92
SCHNELLE BUNTE BILDER
Huber-Pohle-Timpernagel GbR
Rudolfstraße 11
D-10245 Berlin
mail@schnellebuntebilder.de
+49 30 983 884 92